

Harmful Algal BloomS Observing System
Go to...
Select Harmful Algae Species:
Exclude
"Not Observed" Reports (X)
Click on any of the displayed analysis points to get additional
information.
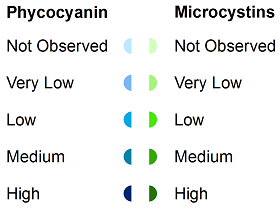
Classification of Report Values:
Select Date Range:
Select Predefined Condition:
Classification of Report Values:
| Not Observed | ||
| Very Low (1 - 10,000 cells/L) | ||
| Low (10,000 - 100,000 cells/L) | ||
| Medium (100,000 - 1,000,000 cells/L) | ||
| High (1,000,000+ cells/L) |
Select Cyanobacteria Type:
U.S. River Streamflow - USGS 
| ||
| Bathymetry - NGDC | ||
| Estuarine Reserves | ||
| Marine Sanctuaries | ||
| Eastern Oyster Beds | ||
| Latitude-Longitude Graticule | ||
| Chlorophyll 3-day Composite |
||
| Chlorophyll Anomaly |
||
| Chlorophyll - Monthly Climatology |
||
| Enhanced True Color (RGB) |
||
| Normalized Fluorescence Line Height |
||
| Sea Surface Temperature |
||
| Sargassum Density |
||
| Daily Optimum Interpolation Sea Surface Temperature (DOISST) | ||
| Buoys
- NDBC
|
||
|
Texas Buoys - Currents
| ||
|
NOS CO-OPS Ports Buoys - Currents
| ||
| NCEI Water Temperatures (Historical) |
||
| USGODAE Aerosol Model |
||
| Sea Surface Heights
(Forecasts & Hindcasts) |
||
| Sea Surface Salinity
(Forecasts & Hindcasts) |
||
| Water Temperatures (Forecasts &
Hindcasts) |
||
| NWS Current Weather Radar | ||
| 12-Hour Precipitation Forecast |
||
| Current Wind Speeds |
||
| NWS Maximum Air Temperature (Forecasts) |
||
| Probability of Precipitation (Forecasts) nowCOAST |
||
| NWS Precipitation Amount (Forecasts) |
||
| Wind Speeds (Forecasts) |
||
| Weather Observations | ||
|
Ocean |
|
Satellite |
|
National Geographic |
|
Topographic |
| Use Measure Tool |
Clear Route

You currently
have no additional layers drawn on the map.As you add layers to the map, they will
be listed in this panel.You may use this panel to remove any layers added to the
map. You can also go back to the "Add Layers" tab to remove layers.